How Sweet is it?

Across countries, ethnicities, and even species – a sweet taste elicits an inherently positive response that ranges from pleasure to analgesia. We have evolved this behavior to reinforce the biological link between sweet taste and sources of nutritional energy (calories).
Conversely, bitter substances have an innately negative response as they are associated with poisons. Outside of a narrow therapeutic window, drug actives can be injurious, so it’s no surprise that many APIs are bitter, some extremely so.
Contrary to the widely held mythology of taste masking, bitterness cannot be reduced by the addition of flavoring aromatics – orange, grape, chocolate mint – due to differences in perception pathways (taste vs.smell).
Bitterness can however be reduced by blending with the other complementary basic tastes – sweet, sour and salty – through the mechanism of taste/taste interaction. When properly blended, the result is a neutral tasting (“white”) base in which the basic tastes – bitter, sweet, sour and salty are not separately perceived. This is the fundamental principle of taste masking.
Frequently, the first step in formulating a white base is to select an appropriate sweetener system – but which one to pick?
A Multitude of Sweeteners
There are numerous candidate sweeteners to choose from, and the selection of which to use is informed by technical, regulatory and clinical considerations.
From the technical perspective, these sweetener candidates are not interchangeable, as each has a different sweetness profile – a characteristic intensity, onset, and duration. Understanding the difference between candidates is critical to effective taste masking. The remainder of this post will focus on the complexities of sweetener “intensity”.
Sweetness Intensity
Broadly speaking, there are three categories of sweeteners: nutritive sweeteners, sugar alcohols, and high intensity sweeteners.
The class called nutritive sweeteners consists of roughly a dozen different mono, di, and oligo saccharides commonly used to sweeten foods. These include dextrose, fructose, and (most importantly) sucrose. All have a pleasant sweetness, but are high in calories, cariogenic, and bulky (used in oral formulations at concentrations between 10% and 60%).
For decades, the food industry has endeavored to reduce nutritive sweeteners through the use of low or no-calorie substitutes. Sugar alcohols are one option. These sweeteners are found naturally in small amounts in foods but prepared commercially via the hydrogenation of nutritive sugars or by fermentation. Sugar alcohols do not have the caloric or cariogenic concerns of nutritive sweeteners, but are similarly bulky, taking up 10-60% of the formulation.
More potent are high-intensity artificial sweeteners. To date, six high-intensity sweeteners are FDA-approved ingredients under the Federal Food, Drug, and Cosmetic Act:
- Saccharin
- Acesulfame potassium
- Aspartame
- Sucralose
- Neotame
- Advantame
With the exception of advantame (just approved in 2014), all are precedented for use in drug products per the FDA Inactive Ingredient Database (IID).
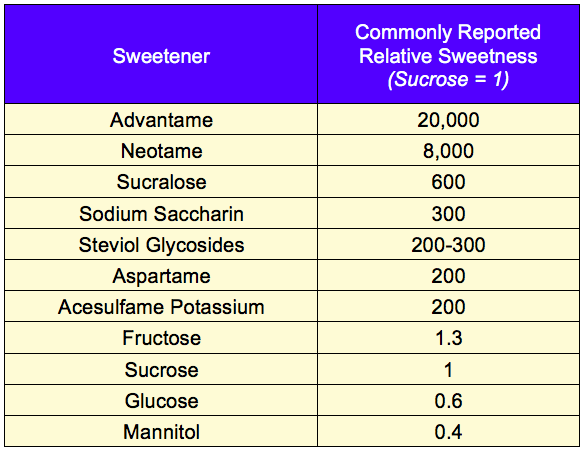
The relative sweetness intensity of sweeteners is commonly reported in the literature (Figure 1), but this number is a gross oversimplification.
Figure 1 – Relative Sweetness of Common Sweeteners

For example, this data suggests that the sweetness of a regular sugar-sweetened cola could be achieved with acesulfame potassium (Ace-K) at 1/200ththe concentration of sucrose. In reality, Ace-K cannot replicate the sweetness of sugar-sweetened cola at any concentration.
How can this be?
Sweetener Concentration Response
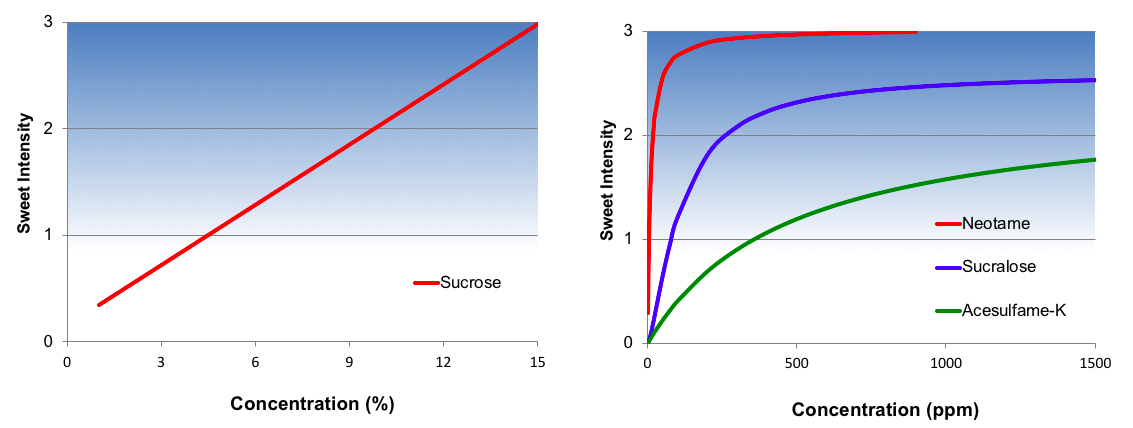
A single number that describes relative sweetness is only appropriate when the concentration-response relationship is constant. This is the case for nutritive sweeteners and sugar alcohols, as they have a linear concentration-response function as shown for sucrose in Figure 2 below. In other words, perceived sweetness increases linearly as sucrose concentration increases. Mathematically, this is describing the slope of the concentration/response relationship.
In contrast, high intensity sweeteners have a nonlinear concentration-response function as shown in Figure 2 for three common high intensity sweeteners. At low concentrations perceived sweetness increases rapidly but then begins to diminish and plateau. In these instances, a single number describing this complex relationship is wholly inadequate.
But what is causing this plateau effect? Part of this change is the simple explanation that the marginal contribution of sweetness is decreasing. While that is true, the more interesting phenomenon underway is that above a certain concentration, the “sweetener” actually begins to taste bitter. This emerging bitterness self-balances with the marginal sweetness, resulting in the observed plateau.
From a formulation standpoint, the location of where this sweetness plateau ultimately occurs is extremely important. For some sweeteners this is well below the upper limit of perception of sucrose. A typical sugar-sweetened soft drink has a sweetness intensity of about 2½ on the Flavor Profile scale. Ace-K has a maximum sweetness intensity of about 2. For this reason, Ace-K cannot be used alone in zero-calorie soft drinks, but rather must be used in combination with other high-intensity sweeteners such as aspartame or sucralose.
In summary, relative sweetness data is meaningless in the absence of the corresponding sucrose concentration and therefore is of limited value to pharmaceutical scientists.
Figure 2. Concentration Response Curves for Selected Sweeteners
 Source: Dubois Et. al 1990
The Fallacy of Sweetness Intensity in Taste Masking
When faced with an intensely bitter API, a formulator may choose to start with the most potent sweetener candidates. However, as described, the values reported in the literature can be misleading.
In working with high intensity sweeteners, if a little is good, more is not better. As we have described, some artificial sweeteners become bitter at inappropriately high usage levels.
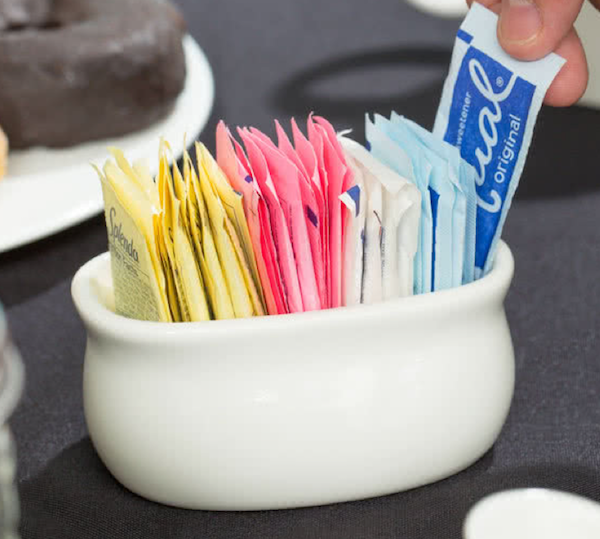
This fact can be easily demonstrated at home or in restaurants with packets of sugar replacement — pink (saccharin), yellow (sucralose), green (steviol glycosides) or blue (aspartame). Because of their high potency, in each case the sweetener is diluted with an inert buking agent (e.g., maltodextrin). When added to 8 ounces of coffee or other beverage, the sweetness reasonably replicates that of sugar. Now experience the taste of the same packet poured directly on the tongue. You will be surprised that it tastes nothing like a spoonful of sugar! It’s initially sweet then shortly followed by bitter. In other words, high intensity sweeteners can exacerbate the taste masking challenge if not used appropriately.
Understanding Sweeteners
Sweetener performance is highly dependent on its inherent sweetness profile, as well as the flavor of the drug product (API and excipient system). Given this complicated set of interactions, the performance cannot be predicted a priori.
In this post we described the sweetness response function for nutritive and non-nutritive sweeteners and the concept of sweetness intensity.
In future posts we’ll be exploring the other aspects of the sweetness profile – namely onset and duration – as these attributes are also important for taste masking.
Taste Masking Challenge? Senopsys Can Help!
Are you faced with the need to develop a palatable drug product to support clinical trials or commercial development? Our scientists are expert in both taste assessment and taste masking.
We use our experienced GCP-compliant taste panels and analytic tools to quantify the taste masking challenge and guide formulation development. And we apply a structured, sensory-directed development approach pioneered in the food industry to create palatable, taste-masked drug formulations for liquids, powders and solids.

